THE ORR GROUP Releases 2014 4th Quarter Tabletop Gaming Industry Report
Creators of Roll20 Virtual Tabletop report 5th Edition Dungeons & Dragons Surge
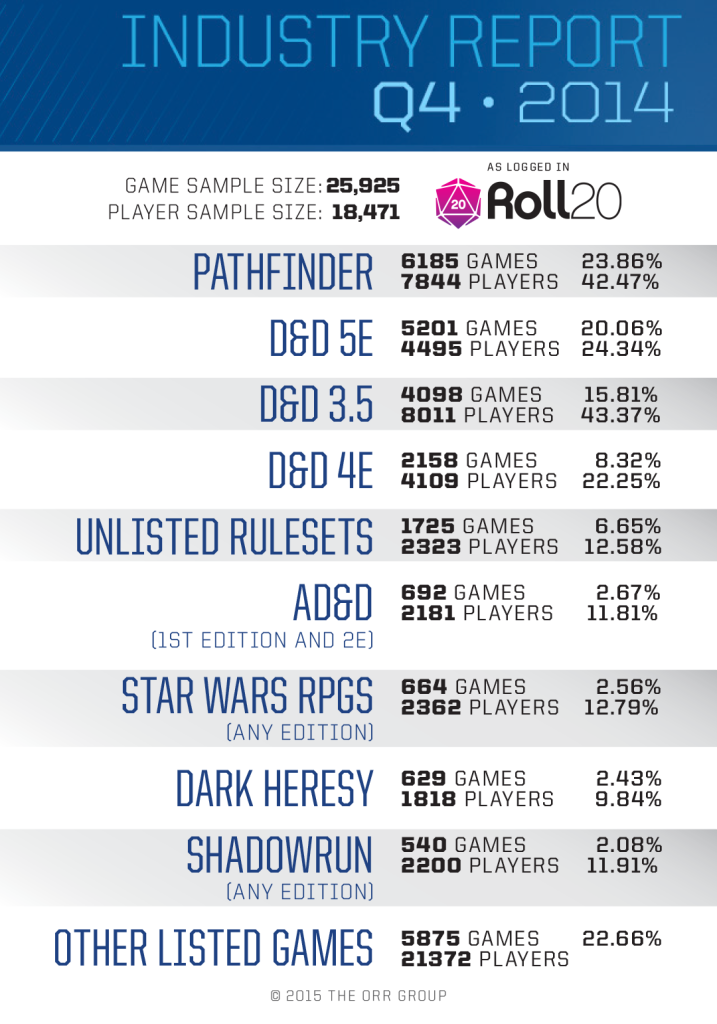
Kansas City, Kansas (January 8th, 2015) The Orr Group, creators of the Roll20 Virtual Tabletop, have released their newest collection of game popularity data from their system in the form of an Industry Report. The biggest change since the third quarter report is the significant growth of the 5th Edition of Dungeons & Dragons from 12% to 20% of all games played and from 16.6% to 24.3% of players.
“It is clear that the release of the Dungeons & Dragons 5th Edition tools like the Monster Manual and Dungeon Master’s Guide along with The Rise of Tiamat adventure book stirred Roll20 users towards picking up and playing in this new rule set,” said The Orr Group cofounder and Roll20 spokesperson Nolan T. Jones.
The Orr Group Industry Report also saw changes from last quarter via growth in number of respondents and several new games being added to the list.
“We expected our sample size to grow with population, but we also believe more users are taking the time to select what games they are playing in reaction to knowing their selections are being noted by the roleplaying community via The Orr Group Industry Report,” said Jones.
Roll20 began as an effort to keep The Orr Group founders Riley Dutton, Jones, and Richard Zayas in touch via long distance gaming. Since launching via Kickstarter, it has attracted more than 725,000 users as a free service. The program continues to be funded by subscribers who receive features that assist advanced gameplay.
###
Here is a summary of the report numbers. My commentary is below.
Those are some interesting numbers! Folks curious about how they gather their numbers in a little more detail should take a look at their blog post explaining their method.
For those that want the quick summary, they essentially mine the data from two parts of Roll20. The Personal Profile page where Roll20 user can list what games they like to play. For them to be counted, according to the blog post, the player has to have been active in the quarter the data is compiled. The My Campaigns area is also used to mine this data. This is the page where a GM states what game he or she is running. Those two locations are where the numbers for Game % and Player % are generated.
For this quarter’s data it looks like the data was pulled from a collection of nearly 26,000 games and 18,000 plus active players. Definitely an interesting snapshot into what is being played on what is one of more successful VTTs out there.
It is also interesting to note that unlike ICv2, which is focused on sales, Roll20 doesn’t rely on certain systems to have had new releases or currently in print books. Their data mining is much more a look into what is actually being played.
This should be an interesting way to see what is out there being played as future quarterly reports are released!


